Often when running conversion rate optimization A/B testing (split testing) the tests are concluded too early even though the results are showing a statistically accurate result. To avoid this false positive a general understanding of the life of a test and what can affect it is required.
Why does my A/B test look great then start dropping in lift.
This often happens when you are adding a new test to a currently running control. For example you are testing two variations and you stop both and add a new one combining the two. When you start the test the number of visitors is low (denominator) therefore the fraction is a higher. 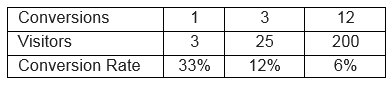 The conversion rate in the beginning of a good test is always high because the denominator is low. Once you give it time it dampens out and will become more accurate. As you can see the pink variation has a big spike then levels off toward the light orange (control) conversion rate. This is why we want to run a test for at least a week.
 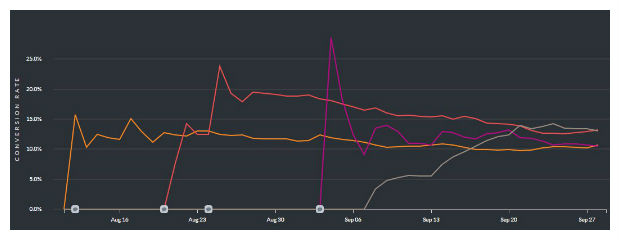 The other reasons for running a test for at least a week is the type of traffic can fluctuate over time. The causes of this are due to the following:
- User types – weekend users, weekday morning and afternoon users. For example a business user may convert differently on weekdays than weekends.
- Traffic and ad fluctuations – ad placement changes over the week by Facebook, Google and Bing. Unfortunately we cannot control when an ad is shown and where as much as we would like. It is not unusual to have a spike of ad traffic from a source that may have different quality or user type. The test has to run long enough to capture all user types.
- Device anomalies – Some tests need time to collect enough data to analyze desktop vs mobile variations. Mobile users are using the phone on different days and times of the day.
Because of these reasons a test should run at least a week even if the test is statistically showing a positive lift.
How can I speed up conversion rate optimization testing?
If you are trying to understand how much your element under test affects conversions there are no short cuts. However if you want to quickly test with a result of “has a lift” or “does not have a lift” then you can prematurely end some tests as long as your final test is run to conclusion. Can you tell which variation below could be stopped early? 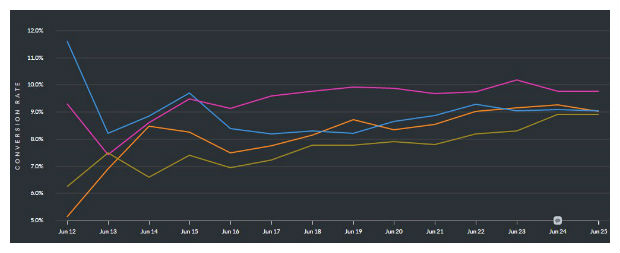 When orange is the control.
The blue variation looks great in the beginning but in the end it is equal to the control. If this test was stopped on the third day the blue variation would not provide any significant lift and possible a negative result although your initial results said otherwise.
The pink variation is above the control all the time, this can indicate a solid positive test. If the test was concluded early the estimated lift would not be accurate but at least there would be a positive lift.
The dark yellow variation was negative after the second day and stayed negative. This test could be stopped early. Usually a good test shows positive results or a consistent daily increase against the control.
Every page has a deviation in conversions overtime depending on the traffic type. If you do an A/A test and track the conversions over time you will see the difference between the two A/A results will decrease. The amount of time it take for both A/A versions to have the same conversion rate is an indication of a minimum test time. It is also your noise floor or the lowest conversion lift you can accurate state. For example if the deviation is always .5% all of your tests must have a lift greater than .5% to be accurate.
Conversion optimization A-B testing guidelines
- Always run a test to statistical confidence of 90% or greater. Note that different A-B testing systems use different algorithms such as chi squared, z-score and derivatives of these. This means there is a variance when comparing data between different testing systems but if you are testing to above 90% you are ok.
- Always run a test for at least seven days even if you have a statistical winner earlier. This will account for advertising, user personas and user device variants. Of course this also depends on the amount of traffic and conversions you are getting. It is not unusual to run a test on a page that has a low volume of couple thousand visitors for a month.
- Look for test variants cumulative conversion rate compared to the control and see if the lines cross or are consistently above or below.
> Above control – most likely a solid lift
> Criss-crossing the control – the test has not run its course yet and is not statistically accurate
> Below the control and not going positive – most likely a negative lift, this type of variant can be stopped early to speed up testing. - Check the data by device. Often devices can cancel each other’s results out. A desktop may have positive result but mobile may not, making the total conversion lift not as great as could be. This also tips you off that mobile only tests are needed.
- Be conscious of other factors during your testing period such as holidays, ad campaign changes, lifts in traffic due to other corporate initiatives.
- Doing an A/A test can help determine length of test and minimum conversion lift.
- If you are not sure it does not hurt to continue running the test unless the results are negligible.

- The Rise of Intelligent Websites - February 19, 2025
- Top Trending Products to Boost Your Shopify Store in 2024 - September 4, 2024
- AI Terms Glossary: Key AI Concepts You Should Know - August 22, 2024